As community managers, we can guarantee you that you are not alone, but you just made the BEST decision of your career by coming to us. Our team of experts is here to dedicate their talents to make YOU regain your popularity, without judgement and with full trust, in a record time. May it be from a big controversy or a simple popularity decline, our goal is to develop a data-driven strategy for navigating the aftermath of public disinterest using insights from YouTube’s ecosystem.
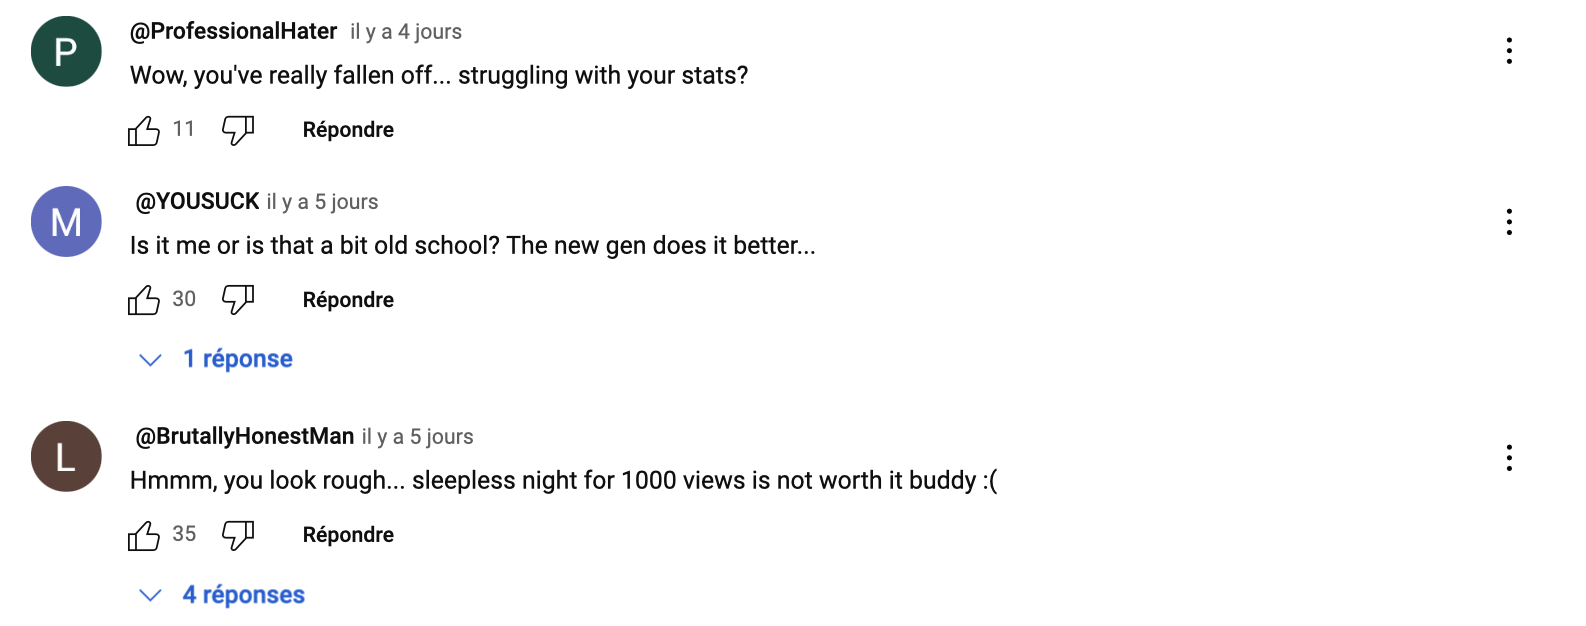
Does that sound (too) familiar? Then you might just need our help…

How ? By drawing on patterns from previous YouTuber experiences, we’ll analyse key metrics—such as your channel type, initial popularity, posting frequency to offer tailored strategies for re-engagement, so that you can fully focus on the fun and creative aspect of your job! Should you do clickbait ? Adress your decline in an apology video ? Post more often or change topics slightly ? Our motivation stems from the spread of online backlash, that has visibly impacted creators on YouTube and other platforms. Eager to offer them unforeseen solutions and break the stigma on subscribers loss, we aim to help you make informed decisions about your next steps to rebuild audience trust.
Research Questions
- How do we define decline for Youtubers ? How do we define a recovery ?
- Is a Youtube channel category affecting the effective response strategies after a decline?
- What timing and content strategies are best for re-engagement following public backlash? Should you change your posting strategy?
- In the case of a ‘bad buzz’ for bigger Youtubers, how to define it using statistics? Are apology videos really useful?
Why should you trust us ?
Why us and not some wanabee adviser on YouTube ? Well, because we based all our work on a scientific, multi-dimensional, and extensive dataset… YouNiverse (see more information in the tab Ressources). This dataset, released in 2021 is a precious ingredient in our recipe, because Youtube is such a colossal platform that it is quite discouraging to try and sample it. It is composed of data samples from over 136k channels and 72.9M videos published between May 2005 and October 2019. Cool, right ? Well that’s our biggest asset in this quest for recovery. It is a long, tedious process, with the main negative aspect being the fact that only english-speaking videos were integrated into the database… oups. Lots of things to say about this great dataset, if you’re eager to know just check the below easter egg were:)))
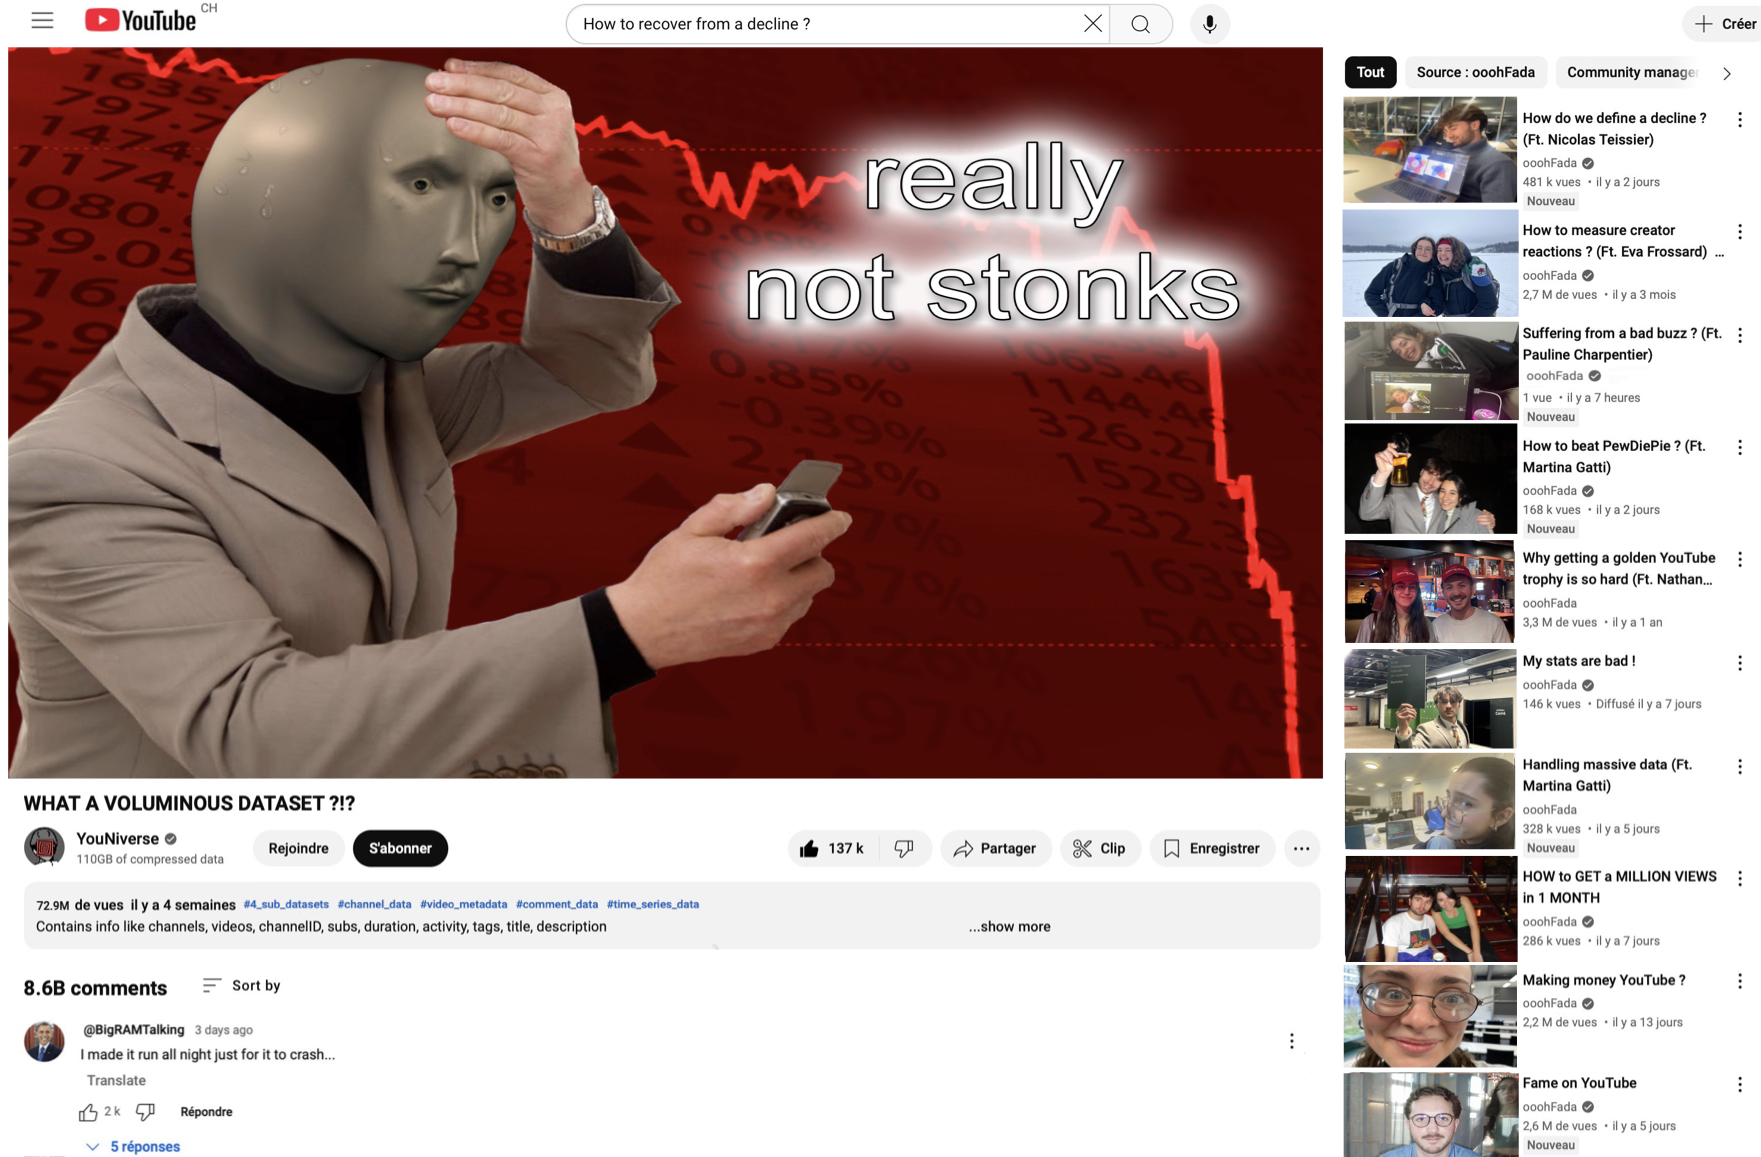
Before any piece of advice, how do we define a decline ?
You feel like your viewership is going down and your stats are struggling ? We know how painful that can be when you’re trying to be on your A-game and you’re putting all of your time and energy into your channel.
Let's keep it real, there are very few chances you're actively losing subscribers (or maybe you are actually a famous Youtuber and you did fumble, you should go check out our bad buzz section ;)). If you're not in the middle of a controversy and cancel culture hasn't got the best of you, chances are you are just experiencing a decline. In most cases, your situation will fix by itself. However, if this has been going on for more than a month, maybe you should check out our analytical tool !
Since Youtube hasn’t stopped gaining new users, we have reached the conclusion that very few channels will actively face a decrease in their total subscriber count. However, we can detect decline by noticing in your stats a significant slowdown in the growth rate of your subscribers, which may indicate potential issues such as reduced engagement or a negative reception by the audience.
Rolling average
Why ? Because the rolling average acts as a smoothed baseline, calculated using a defined window (we arbitrarily used a 'window' of 20 weeks), which helps to identify deviations from the expected trend. When the growth of your channel falls below the rolling average, it suggests that the channel's performance has dipped relative to its typical trend.Here, a simple moving average was implemented as followed: \[ SMA_{20} = \frac{p_{n-20+1} + p_{n-20+2} + \cdots + p_n}{20} = \frac{1}{20} \sum_{i=n-20+1}^{n} p_i \] With \( p_1, p_2, \dots, p_n \) the data points
Here is a little exemple of how a channel subscribers graph looks like:
As you can see here, the channel of the Mr. Random Lance Stewart underwent 2 declines represented by the colored purple zones. Not a good job Lance…
After playing around with parameters, we have decided on the following:
- a minimum duration of a decline of 8 weeks: you could be on holidays without it being a decline ! This allowed us to reduce considerably the ammount of datas that was unusable due to its size and the computation power it was requiring.
- if the decline was ‘intense’, meaning that there was a 80% difference between growth index of your channel and the rolling average, we consider that the channel underwent a massive backlash, and may it be shorter or longer than 2 months, it should be counted as a decline (and a big one, what did you do ?)
After doing so, a little update on what our database consisted of: we had 74788 channels that underwent declines, with more than 121998 episodes… See ? You’re really not alone ! And more than enough to pursue our study !
From our data, if your experiencing a decline, you might just be in it for more than 3 months… and maybe even forever ! Let’s get this number down for you in the net…
To make you visualise a bit more, here is a little glimpse at the biggest Youtubers’ declines, so you can see how well our decline detection works (with a little drama too…)! If you’re one of those big Youtubers we mentionned before, or even one of the one present in the below pannels (Jake Paul is that you ?!?), don’t hesitate to go check out your dedicated section.
Okay, okay, we might just be rubbing salt into the wound right now with loss, declines, failures… let’s talk about more positive things… the recovery !
So what do we considered being an efficient recovery ? Since we do not want you to fall into the unknown for too long, but we still consider normal that a recovery is not happening in a flash, we consider that your recovery was successful if it happened in the span of 16 weeks, or 4 months. Yes, that’s the median, and that may seem not very ambitious BUT Youtube is not a forgiving space, and we would consider ourselves happy if you do better than half of the population.
More than 16 weeks and our model will sadly announce that you have one foot in the grave, and that Youtuber might not be a durable hobbie for you… sad, but your mom told you so years ago! Here, using our tools, our goal is to put you out of the woods before this deadline and if declines didn’t end in 4 months, our program will consider that your recovery has failed. Sorry !
Can we predict your chance of efficient recovery based on your stats pre-decline ?
Okay, here is the state-of-the-art with some stats about recovery… not good right ? We can’t hide the evidences: by our standards, the majority fails to recover efficiently. No time for thumbnail fine-tuning and title brainstorming here. As the stakes are high and time is running out, we have decided to focus on the most important metrics that can help you recover from a decline, let’s explore them !
What will be the first metric is actually very naive but still shows some results: it’s the category. You might have thought this was an insignificant parameter when you opened your channel years ago (shout out to the 12 years old you), and even if your content doesn’t fit with the category name today… well the latter might still play a role.
Best categories to have a decline in ? Little podium: News & Politics (the 24/24 activity might be in your favor here), Gaming, Travels and Events...
On the other side, the underperformers are Music -where rap is often quite unforgivable- and Pets and Animals.

Interesting metric, but don’t start sweating just yet, we’re just getting started…
So what about views and subscribers ? Is being a renowned Youtuber providing you with more chances to recover efficiently ? Well… not really, quite the opposite truthfully. Yet again, the two trends are not too scarred, but even though we see the usual 60-40 proportions appearing, we also see that small channels (under 3000 subscribers) seem to recover better than your usual golden trophee youtuber?

Moving on to activities (whether you post once a day, once a week, every now and then). This metric doesn't display any noticeable trend, and we can't really conclude that the try harder has more chances of getting out of the woods than the chill guy. Maybe some other modelling will help us get to the bottom of it, just be patient.
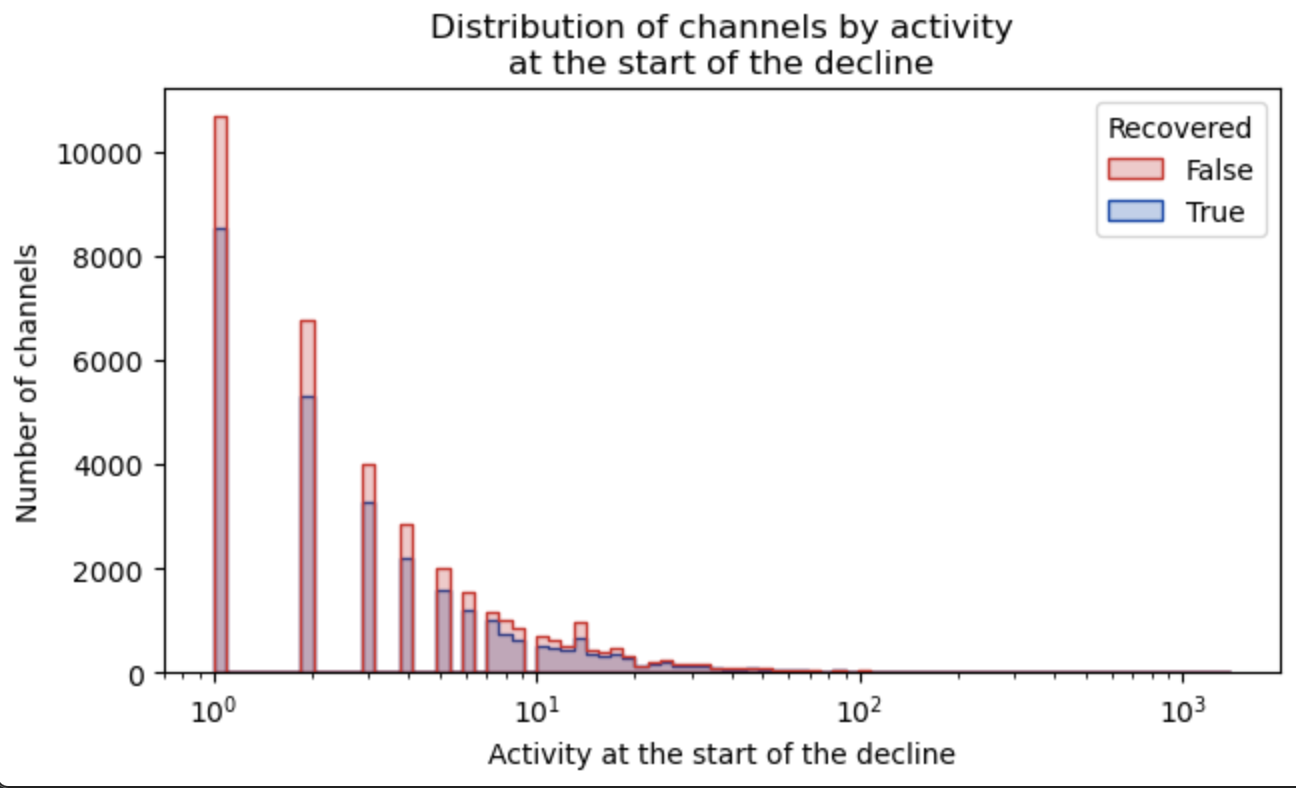
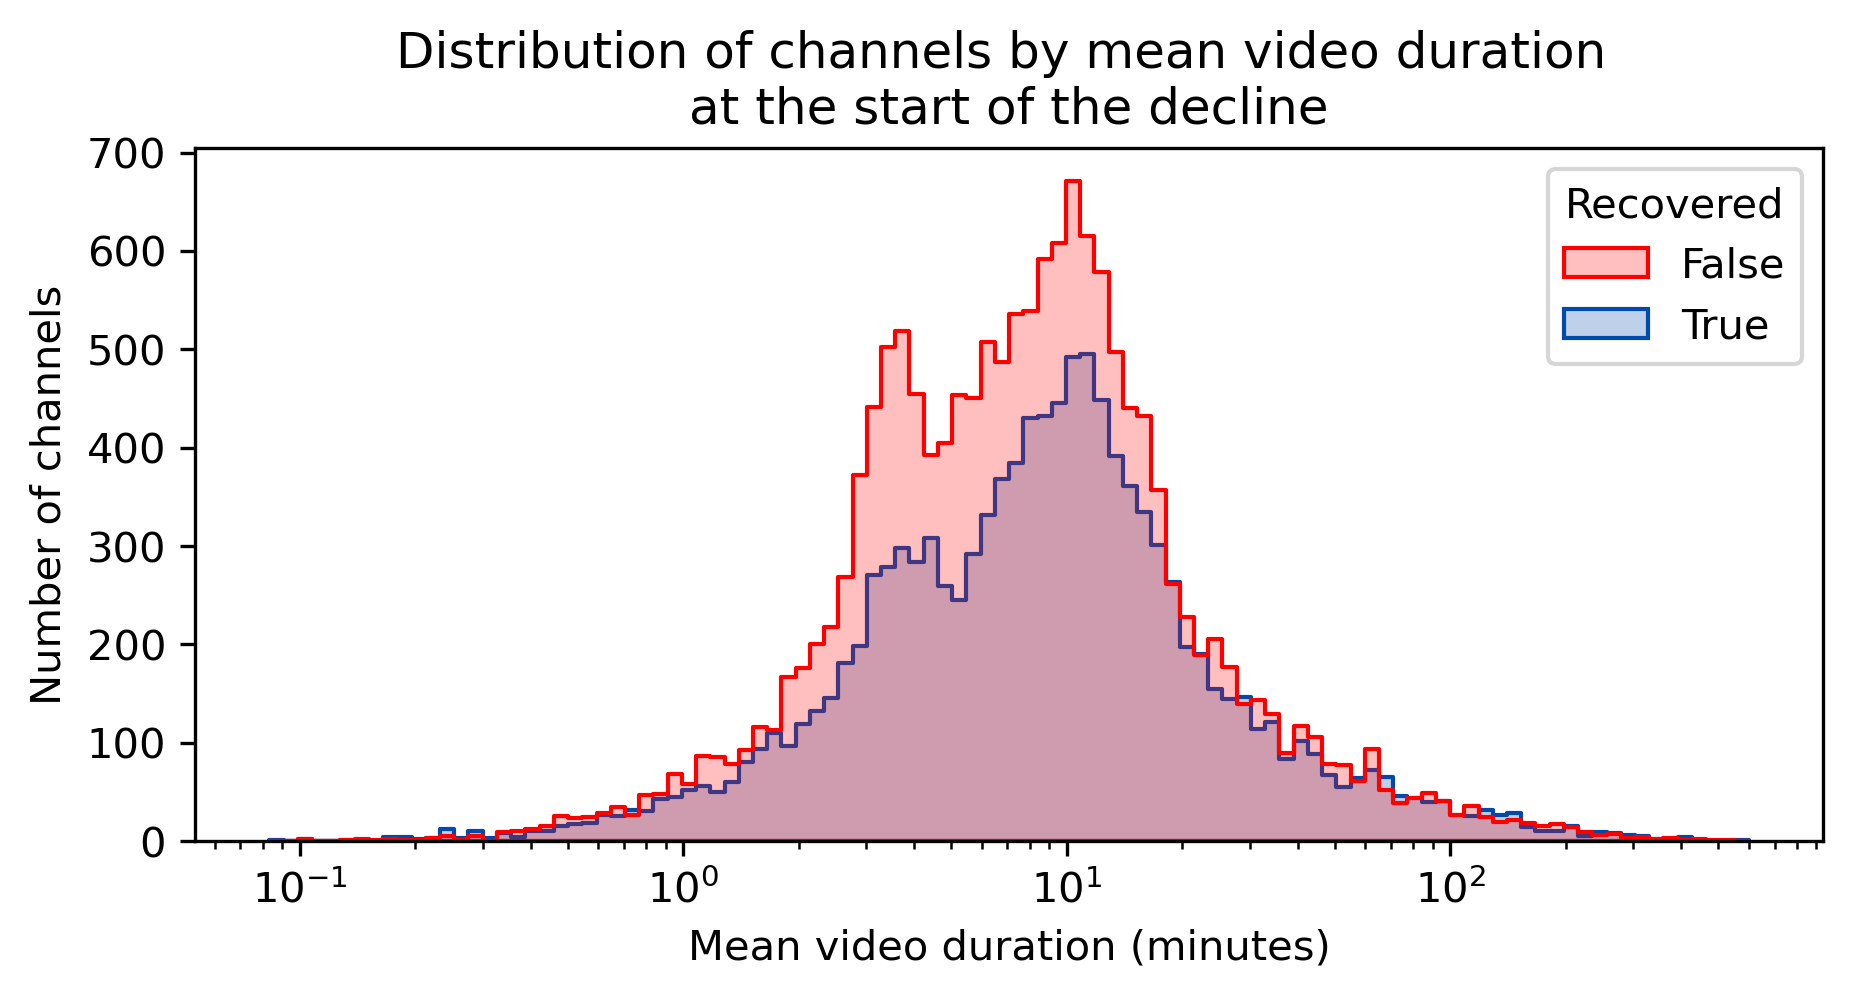
Finally, about the length of your videos, we obtain some disappointing results. The 60/40 distribution is very appearant and there are no unexpected behaviours. Video duration doesn't seem to be a good criteria, but only the analysis will tell us...
Okay, we’ve been introduced to the holy quatuor: categories, fame, activity of your channel and duration of video to see if they provided us info on your channel chances to regain its previous flourishment. We have noticed that it is possible to see overall trends, but nothing precise nor statistically relevant.
Let’s now get into how YOU can impact the health of your channel, meaning how YOU can react ans use those metrics in your favour. We will start by citing all the different strategies we have observed (yes the same strategies you have probably been wracking your brain with), before putting our lab coat and taking our calculator to see if those methods are truly useful.
What are the possible strategies observed when facing a decline qualitatively?
Taking advantage of all the data that we have at hand, our research team identified the types of key metrics that measure creator’s reactions in times of crisis, and we will now walk you through them. Take notes !
Upload frequency
You might have thought that getting more active on the platform would make you regain your audience or at least will bring you a new public, because the Youtube algorithm would put you forward.
Maybe you’ve considered taking a break, make them wait a little and be more desirable (we see you mister pick-me) before making a big come back ?
Or you are just a chill guy, you also want your audience to just be chill guys, and you didn’t want to force yourself to post or take an unwanted break… so you just kept uploading at the same rythm.
Thus, we have 3 separate groups:

Some creators step back from the platform by posting less

Most of them keep uploading the same amount of content

Others get it together and start spamming videos
Video duration

Keeping up with durations, here we will be focusing on the length of videos. More in the Shorts mindsets or into the long documentary styles videos. Or maybe you like your comedy sketch around the 5min, or conversely, it's the cash coming with the monetization and the multiple ads in over 10min videos (yes, we see you Uncle Scroodge!). Changing video duration will therefore be studied to help you maximise your chance of recovery.
Content category
A third and more daring reaction is to experiment and go out of your comfort zone, by trying new things (new topics, new styles…) and changing their Youtube identity. Maybe you’re starting to think that Fortnite might be a tiny bit too restrictive !
So how can we measure that ? Well we could have used titles and description of videos but this would have required a massive computation power... and our computer just couldn't handle it. But we did better ! We used an awesome feature given by Youtube... TAGS. Those help direct to your channel people that have similar interest and would watch videos with the same topic. Tags are fully customizable so can be as precise as 'Daily vlogs of an esthetician in Utah' and as vague as 'Gaming'.

Getting this data allowed us to determine whether the reactions include changing the topics of interest, and we will use these statistics to find the best strategy. Burning question: How to determine topics based on tags?
Latent Dirichlet Allocation
Unsupervised Machine Learning technique to perform classification of documents, similar to clustering on numeric data, which finds some natural groups of items (topics). It is part of Natural Language Processing (NLP) techniques. The aim of LDA is to find topics a document (seen as a 'bag of words') belongs to, based on the words in it. Each topic is characterized by a list of words (the tokens with the greatest probabilities of appearing in the document). Before applying LDA, the following techniques are performed:- Tokenization: converting the sequence into small parts
- Stop-word Removal
- Lemmatization: Reducing words to their root forms for exemple dancing, dances becomes dance
- Vectorization: Representing text numerically, here with Bag of Words
Ollama
Type of large language model (LLM), locally loaded into a computer. We here used the model Mistral but we will explain more about it later, in the bad buzz section.After using the Latent Dirichlet Allocation, we obtained the following 20 categories named by the LLM. Don’t hesitate to click on the bubble for more details on the words they include.
A little bit of explanation: each topic contains a set of 15 words and their probabilities of appearing within that topic. The selection of 20 topics offers a balance betweeen coherence and interpretability, ensuring that each topic is distinct yet not too niche to be irrelevant. You migt have noticed some inconsistencies such as the letter ‘u’ in Politics, and that requires a bit more of explanation. With these parameters, we obtained a coherence score of 58%, that could be improved if we decided to create more topics (the best coherence score we obtained was 65% with 55 topics), but we decided to stick to 20 topics for our analysis, to take the trade-off between granularity and interpretability into account.
The 20-topic model captures a broad spectrum of interests, ranging from Politics to Fortnite Gameplay. While some of the topics seem to capture content categories very well, like the topic “Movie Reviews” that contains words like “movie”, “review”, “trailer” and “film” revolving around content creators who analyze or review films, there is also some overlap between different topics, for example in the topic “Art and Spirituality” that also contains the words “golf” and “f1” and therefore may also touch on certain hobbies or sports. However, these 20 topics are distinct enough to provide meaningful classifications that will support an analysis of the topic transitions and their correlation with recovery.
Using this Natural Language Processing technique, we are able to determine whether the reactions to decline include changing topics of interest. Before entering into the maths of it, just have fun looking at all the topic transition in the chord diagram and we will use these statistics to find the best strategy and YES the transition between Pokemon and Politics does exists!

As you can see, everything is possible when it comes to changing the topic of your videos! However, since some changes occur more frequently than others, we don’t have enough data to give you meaningful analysis of every transition (sorry for those who wanted to go from News to League of Legends :)). We will thus focus on the most common topic transitions, with more than 30 occurences in our database:
All of those factors… but which one matters !
We have so far just listed the possible reactions, an easy task… but which ones do work? We are going to experiment with a couple of methods to find out about it: Pearson’s correlation, logistic regression, t-tests and others…
To simplify the analysis, we will gather all the possible reactions into 5 categories:
- Posting frequencies with Posted_more and Posted_less
- Duration of videos with Posted_longer_videos and Posted_shorter_videos
- Topic_change based on the tags
Pearson's correlation
Measurement of both the strength and direction of a linear relationship between two continuous variables. It ranges from -1 showing perfect negative correlation to 1 for perfect positive correlation. \[ \rho_{X,Y} = \frac{\operatorname{cov}(X,Y)}{\sigma_X \sigma_Y} \]Where \( \operatorname{cov} \) is the covariance, \( \sigma_X \) is the standard deviation of \( X \), and \( \sigma_Y \) is the standard deviation of \( Y \).
When using Pearson's correlation, it is assumed that the relationship between the two variables is linear, that their distribution is normal and that the variance is homogeneous across all levels of the independent variable.Not the most convincing representation, we are aware. The stronger correlation coefficients are present between posted more and posted less, because yes when you post more, it means you don't post less, and reciprocally, obviously. This also allows us by keeping Recovered in the heat map to perform a very naive analysis of which reactions has the strongest effect on the recovery. From where we are standing, it seems to be the posted less reaction, but let's not jump the gun.
After those inconclusive results, we do not lose faith ! We move on to performing a Machine Learning Model in the hope of predicting the probability of the event ‘Recovered’, which will also help us obtaining coefficients for all reactions and their influence on the event.
Logistic Regression
Supervised Machine Learning model where the latter log odds as a linear function of X. It is fitted for binary classification which applies here (Recovered: yes/no). \[ p(x) = \frac{1}{1 + e^{-(\beta_0 + \beta_1 x)}} \]where \( \beta_0 = -\frac{\mu}{s} \) the intercept and \( \beta_1 = \frac{1}{s} \) the rate parameter
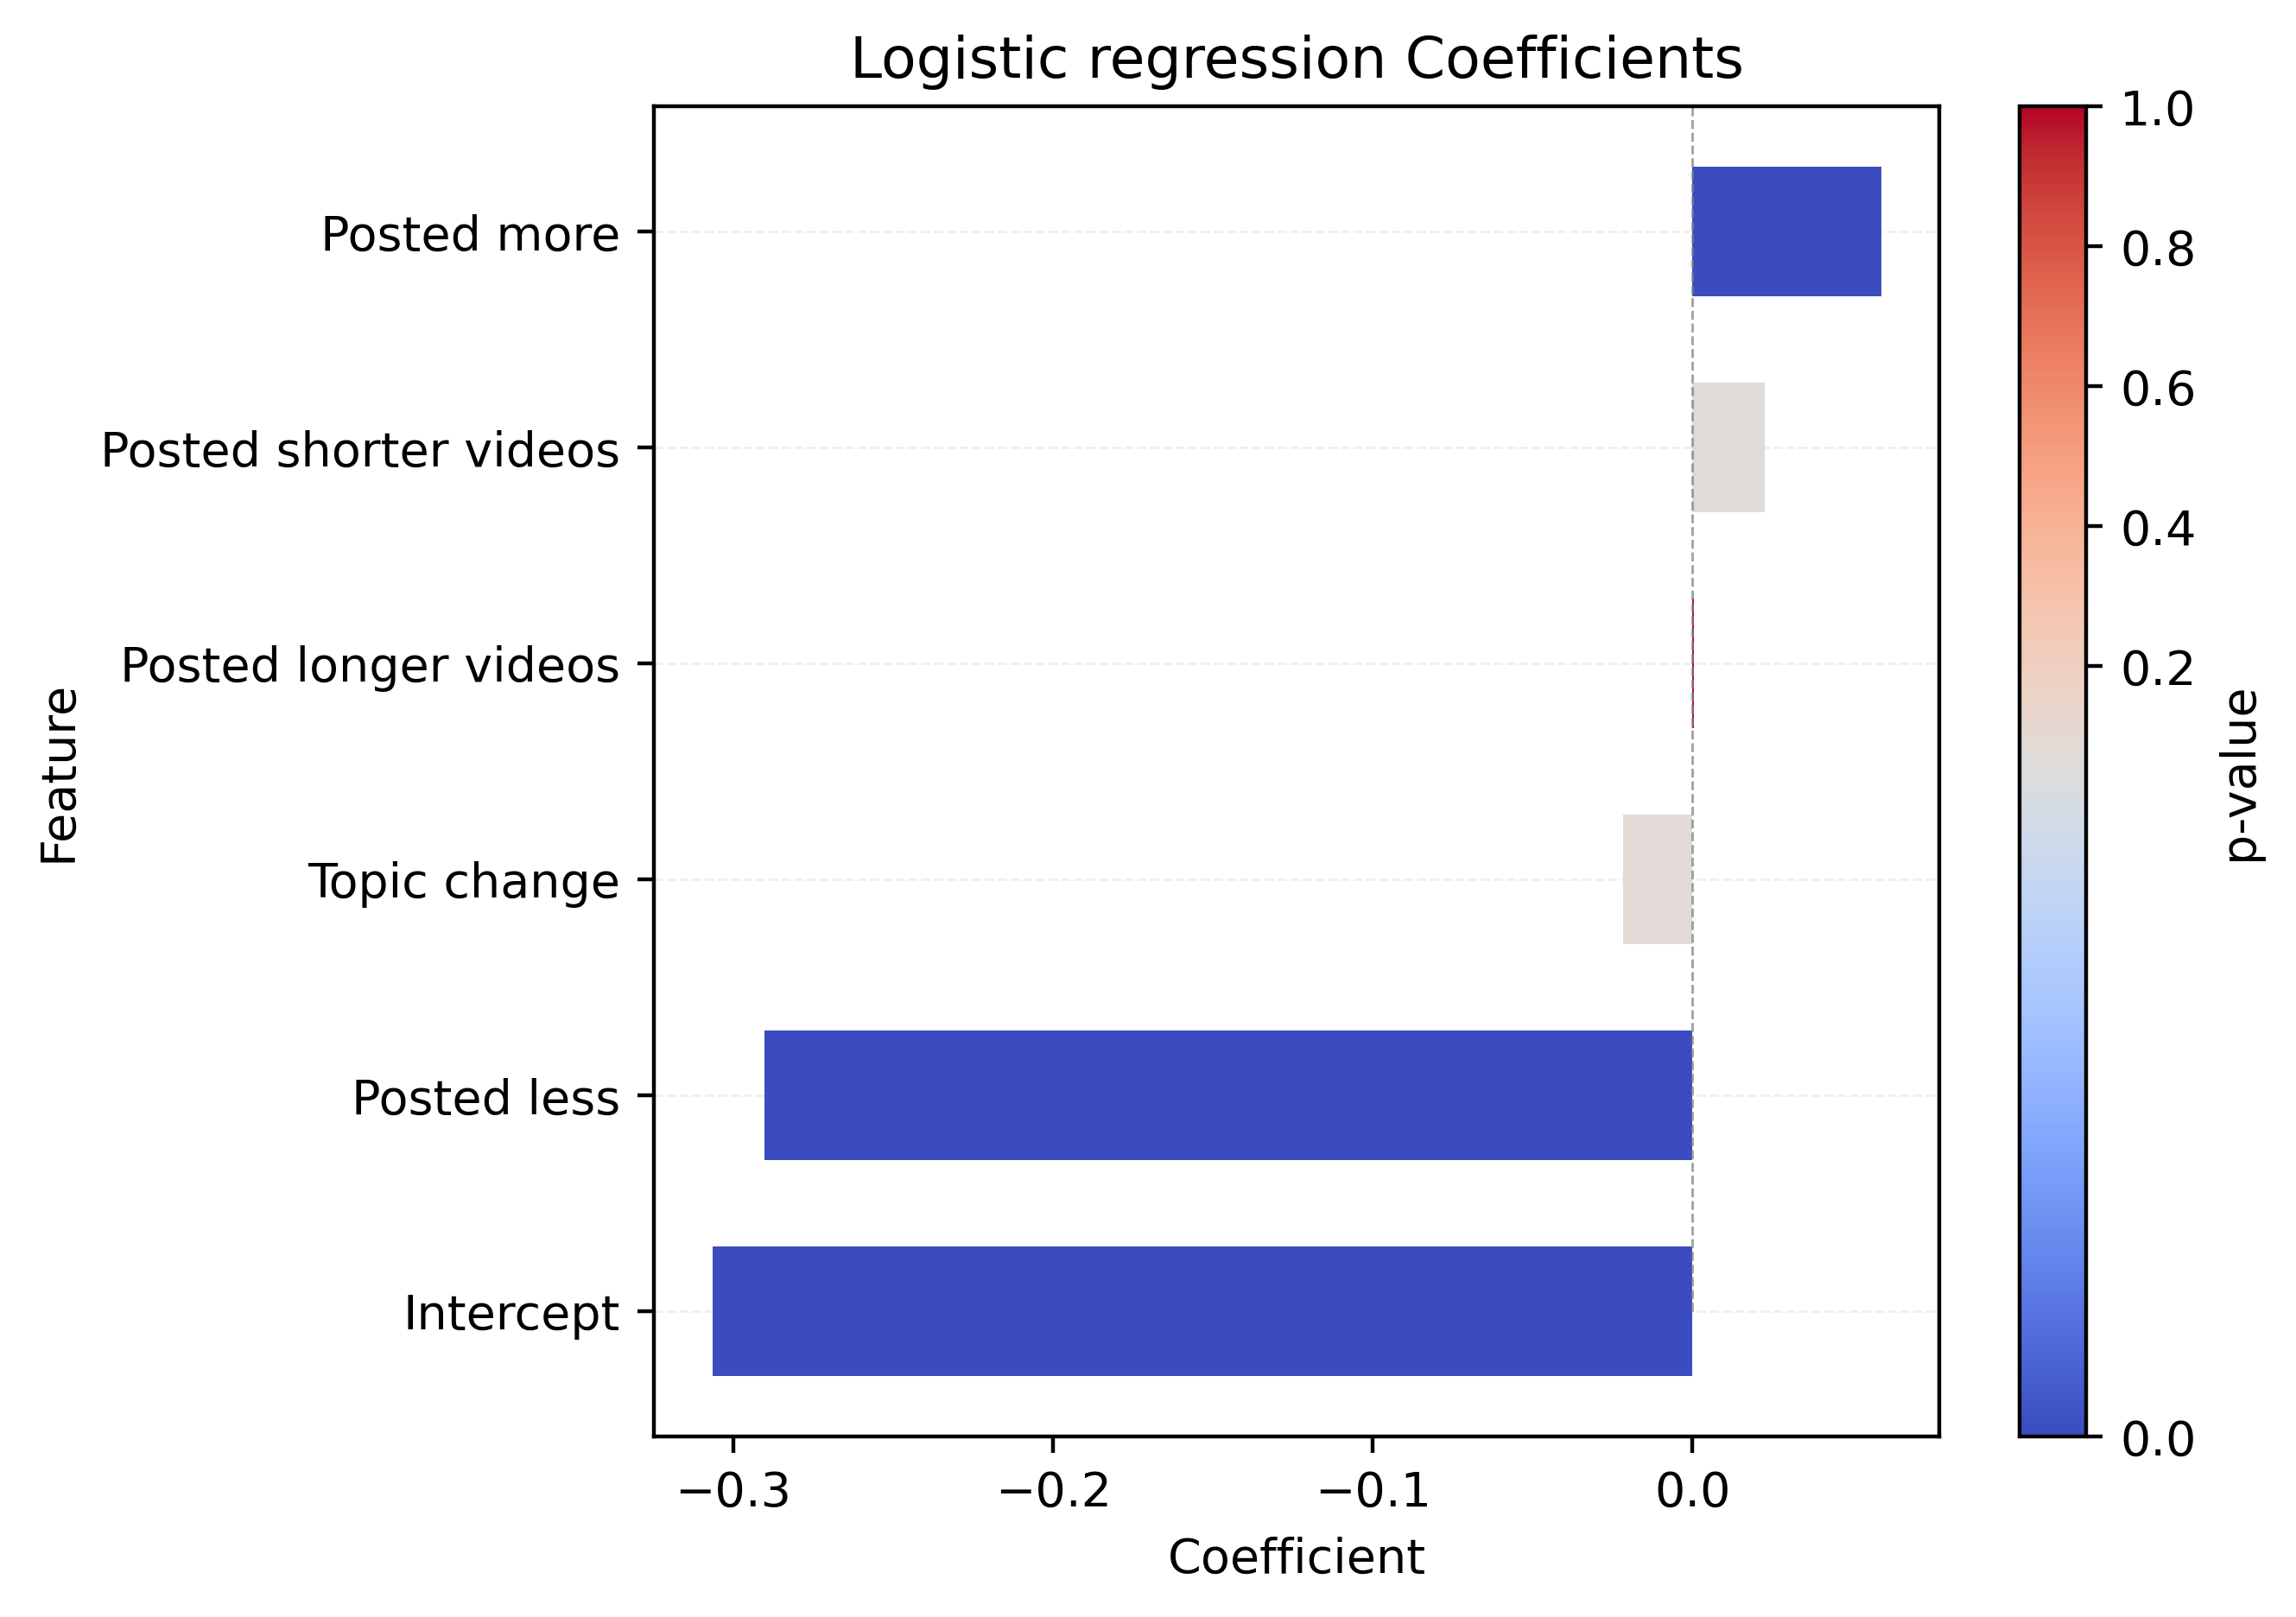
| Variable | Coefficient | p-value | Significant (p<0.05) |
|---|---|---|---|
| const | -0.3 | 0.00 | True |
| Posted_longer_videos | 4e-4 | 0.97 | False |
| Posted_shorter_videos | 2.3e-2 | 0.08 | False |
| Posted_more | 0.06 | 4.05e-6 | True |
| Posted_less | -0.3 | 0 | True |
| Topic_change | -0.02 | 0.08 | False |
All put together, here is the formula for the logistic regression produced on standardized predictor variables:
Where \( D_{\text{group}} \) represents a dummy variable that is \(1\) if the decline belongs to the \( group \) and \(0\) otherwise.
This regression allows us to find how the predictor variables (as stated in the table) influence your recovery. The bigger in absolute size, the more the variable weight in on your recovery. Here, posting less videos, posting more videos and posting shorter videos hold the most importance. But don’t get ahead of yourself yet ! That’s where the p-value comes into play…
p-value
The p-value is a number that tells you how likely it is that the results you see in your data happened only by chance. We will take the threshold of 0.05 (here and for the rest of the analysis).- A small p-value (less than 0.05) signifies that it is unlikely that results are random, so there is probably a real effect and it is not up to chance
- A large p-value (more than 0.05) on the other hand means that the results could easily be due to chance, so there might not be a real effect.
Here, only the variables representing posting more and posting less were significant ! However in different direction… Posting more has a positive coefficient so it influences positively your recovery, whereas posting less influences it even more, but not on the side you would desire…
For ADA specialists
Here is our table of result from the regression. We are very much aware of the extremely low value of the R-squared, and the overall low significance of coefficients. The database has all and every possible values and we tried to find some sort of 'trend', we base ourselves on lowly significant values, but needed to pursue a correct data story.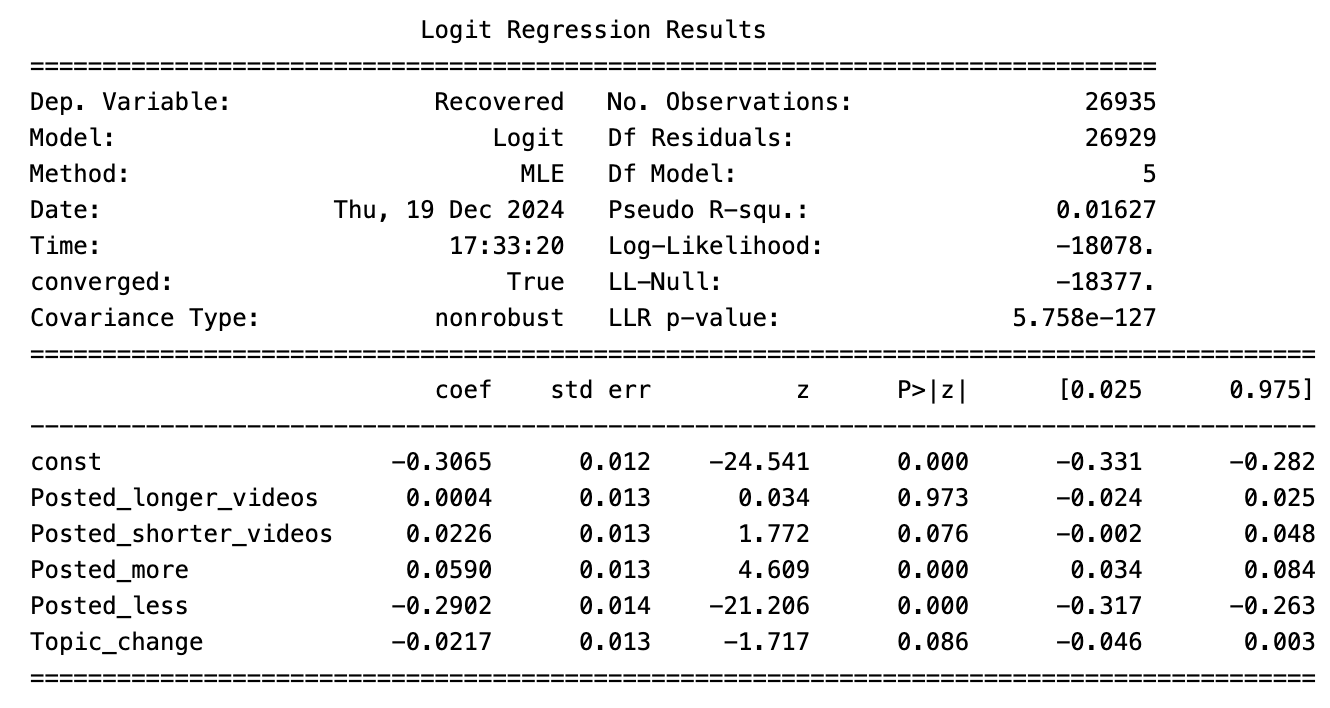
While analysing and drawing immediate conclusions from this simple regression would be quite naive, it highlights an essential fact : Each reaction influences the recovery in a unique way. That is why caution is needed when handling your popularity crisis: One wrong move, and it’s done ! (You sense the gravity now?)
Propensity score matching
Propensity score matching is a statistical technique used to estimate the effect of a treatment by accounting for the features that predict receiving the treatment. It is used to reduce selection bias by balancing the features between treated and untreated subjects, taking into account the various confounding variables.This gives us the following results :
Finally, some long awaited results ! The balanced data suggests that whilst increasing upload frequency has a relatively great effect on recovery with around 10 more points in percentage, uploading less has a bigger impact… by making your recovery chances go down 17 points of percentage, just like we have noticede in the logistic regression. Changing video duration and topics does not seem to play such an important role, if you are a chance maximiser you might still want to post shorter videos and change topic since they show a small increase in recovery.
Welch's t-test analysis
A Welch's t-test is used to determine whether a difference between two groups is likely due to random chance or if it reflects a statistically significant difference in the populations, when the two popualtion variances are not equal. A t-test calculates a statistic called the t-value, which measures how much the two means differ, relative to the variability in the data. \[ t = \frac{\bar{X_1} - \bar{X_2}}{\sqrt{\frac{s_1^2}{n_1} + \frac{s_2^2}{n_2}}} \]with \( \bar{X}\) the sample mean from the samples, and \(s\) the unbiased estimator of the variance
Then, the probability of obtaining a result at least as extreme as the one observed (p-value) is computed and compared to a chosen significance level. In this whole project, we always used a significance level of 0.05 and discarded the null hypothesis, stating that there is no difference in recovery rates between the two group, whenever the p-value is less than this significance level.The results are as followed:
| Treatment | t-statistic | p-value | Significant (p<0.05) |
|---|---|---|---|
| Posted more | 10.69 | 1.43e-26 | True |
| Posted less | -19.94 | 4.57e-87 | True |
| Posted longer videos | -0.15 | 0.88 | False |
| Posted shorter videos | 1.69 | 0.09 | False |
| Topic change | 0.034 | 0.97 | False |
The t-test results reveal that only the two strategies concerning the video upload frequency show statistically significant differences in recovery rates, which is an accordance with the regression results. An increase in video frequency shows a higher mean recovery rate for those who adopted the strategy compared to those who did not. Conversely, posting less videos is associated with a lower mean recovery rate.
This being a very generic results, we will dive deeper into all of those subjects to make you maximise your chances with personnalized advices, since further analysis leads us to interesting results that are worth detailing! Onto the solutions now!
Posting frequency
Good news! Our detailed analysis reveals that increasing your upload frequency is more effective than reducing it, and at a significant level! So what does it mean to increase upload frequency ?
This graph is very straight forward and can be interpreted easily: posting more will give you more chances to recover! However, even if it’s not precised in the graph, that shouldn’t be detrimental to quality… Maybe you could consider trying a Vlogmas situation where everyday something comes out? It has shown its success… whilst reinforcing your community. That will imply some good needed holidays right after, but with a bunch of new subscribers this time! You win some you lose some…
Video duration
Now, about video duration! Are you feeling more Spielberg or TikTok star? While our regression analysis suggests that duration has a limited impact on recovery, we decided to investigate further, looking for hidden patterns.
- Start by determining your average duration of video before you started declining (over around 10 videos)
- Adjust your mean length using our little guide to align your ideal duration with recovery trends.
The questionnaire is based on the following graph, that is thankfully more telling than the previous one.
In conclusion, our team of experts is confident in saying that the ideal video length maximising recovery is between 20 and 30 minutes. This duration may resonate better with your audience, not too long (sorry but you might bore people) whilst still providing interesting content ! Whilst the insight is subtle, it can guide creators aiming to maximize their recovery potential. However, the prospect of the increase in chances of recovery is quite dim for videos around 15min, so you shouldn't bother too much squeezing your content! As we have said previously, the change in duration is not statistically significant, so there are more chances that the results we obtained are due to chance than anything else.
In this analysis of video durations and frequencies, we used Propensity Score Matching to ensure fair comparisons between the different strategies. Since Youtubers differ in many ways (channel size, category, publication schedule, …) and we don’t want to compare channels with vastly different characteristics, we used PSM to match the channels of each duration or frequency bin with similar channels in the remaining database and ensure that any observed differences in recovery rates are more likely due to upload frequency or mean video duration than other confounding factors.
As a side note, since the data from the YouNiverse stopped being sampled in 2019, we do not have any data on new updates Youtube introduce… and this include the great invention of the Youtube Shorts. This Tiktok wanabee might be a key for your Youtube rising fame if you’re into short and dynamic videos ! Just an fyi…
A deep dive into topic transitions

Back into the more fun stuff ! Do we recommend you to change subjects ? Of course, we are here talking to the desesperate that do not mind doing a 180°... promise we do not judge (only a little). Evaluating the impact of subject changes should not be done as a whole: the categories and possible transitions are too numerous to be aggregated into one variable. To go into greater detail, we analyze the consequences by direction: going from Politics to Lifestyle videos should be distinguished from changing from Movie reviews to League of Legends content.
On average, channels that change their video topics experience a slight increase in recovery rates compared to those that do not, again not statistically significant but some fine-tuning is always interesting. While this is encouraging, we have to emphasize that this approach can have mixed results, and the impact on your recovery rate will depend heavily on the types of topics you choose to pivot to. It is not about if you change or not, it is from where and to where you change ! Let’s investigate using a interactive Sankey diagram showing topic transitions and their recovery rates, colored by recovery rate (cooler colors represent higher recovery rates).

Looking to see which topic transitions work in your niche is quite a hassle. For instance, channels focused on movie reviews often see positive changes in recovery when they switch topics, though transitioning to topics like politics could negatively impact your recovery. On the other hand, gameplay channels should be careful when changing topics, as only a shift to Fortnite-related content seems to maintain or increase engagement. It's all on a very thin line!
If you’re considering making a shift, we recommend focusing on topics that have historically shown positive outcomes, such as beauty and lifestyle or gaming-related content, while being cautious about venturing into politics or kids videos, where the change could backfire. Remember that your choice should be guided by your category of origin!

Part of the very exclusive 1 million + subscribers and suffering from a decline ?
Let’s face it — you wouldn’t still be reading this unless you’d royally messed up, would you? You’ve stepped on a landmine, and now your channel is caught in the crosshairs of a… BAD BUZZ 😱.
If you’ve scrolled through the previous sections and still can’t find a fix, it’s because your situation requires more than the usual “post more consistently” or “engage with your audience” advice. But fear not! While the internet’s collective fury can feel like a raging storm, we’ve armed ourselves with data analysis and researchers to help you turn this ship around.
The Challenges of a Big YouTuber in a Crisis
From now on, our analysis will be focusing on the top 4% (2955 out of 74788) of channels (that have had suffered from a decline) — the people just like you, the crème de la crème, in other words the ones with more than 1 million subscribers. You're no stranger to it all, you are the most visible but also the most vulnerable to public backlash.When a big YouTuber like you faces a crisis, the stakes are high. The potential loss of subscribers, sponsors, and revenue can be catastrophic, we are very much aware that you spend your entire day scrolling on Youtube analytics. But the good news is that you are also the ones with the most influence and thus power in their upload content, so recovery is possible (YAY) !
Our analysis of your peers has revealed some fascinating trends. Whether it’s a Twitter faux pas, a controversial statement, or a scandal you never saw coming, the strategies for clawing back your reputation vary dramatically depending on the moves you make right now (Insert dramatic pause for effect. You’re feeling the pressure, aren’t you?). But hey, before you run off to film a tearful apology, let’s talk about why some YouTubers manage to recover from their digital nightmares while others end up in the dreaded “what did they become?” category.
The Recovery Rates of Big YouTubers

We’re not going to leave you hanging with just data and no solutions. Let’s reclaim that subscribe button together! For this, we needed to analyze the recovery rates of these big YouTubers based on the type of video they uploaded. First thing you need to know is that not all of your colleagues have recovered from their bad buzz efficiently.
One could think that that’s not good news, but you have to see the glass half full. What it actually shows is that when focusing only on big YouTubers, the recovery rate is not better... but also not worse !
Just like we did before this case study, let's get more precise and show the recovery rates of your fellow trend setters based on the category of their channel, don't hesitate to refresh your memory by clicking on All channels button.

While the amount of samples is not the same in every category, there is still some interesting conclusion to gather after comapring the recovery rates of big youtubers VS all channels repartition. For exemple, Travel & Events only have 1 decline counted.

This time, the winners are ... At the very top of the podium, the category "Travel & Events" confirms its better than average forgivability with a shoking 100% recovery rate, followed by "Autos & Vehicles" with a solid 90%, you might just be over the moon if you make road trips videos ;)
Sadly, there is also an outcast... the "Music" category! Again, this category seems to be a non-forgiving place, with a very modest recovery rate of 16.85% (two times lower than with all channels).
There are also some categories where big youtubers manage to positively reverse the trend and recover better than the average for all channels. It is the case of the categories "Autos & Vehicles", "Comedy", "Film and Animation", "People & Blogs", "Science & Technology" and our already famous "Travel & Events".
But if there are positive reverses, there also negative ones... "Music" and "News & Politics" are the two categories where big youtubers recover worse than the average for all channels in this category.

While those findings are already interesting, there are only the tip of the iceberg. Any hypothesis on what makes these difference that big? No need to wrack your brain... we have the answer for you !
The Secret Sauce? Your Titles
Yes, you read that right. Titles. Those few dozen characters can either save your channel or sink it further. Think about it: what’s the first thing a viewer sees before they even decide to click? Your title! And if you’ve learned anything from this wild ride of YouTube, it’s that first impressions are everything.Now, here’s where the science kicks in. You’ve probably heard of LLMs (Large Language Models), right? They’re super-smart artificial intelligence tools that can analyse and recognise patterns in text faster than you can say, “Oops, I tweeted what?!”

We used this tech wizardry to dive into the aftermath of 'bad buzz' for the 1M+ club. By leveraging the Mistral model from the OLLAMA open source project, we analysed the types of videos uploaded immediately following their PR disasters.
- Apology videos: The classic “I’m sorry” trope—effective or overdone?
- Addressing the decline: Are you facing the issue head-on or pretending nothing’s wrong?
- Comeback announcements: Bold, confident, and ready to win back hearts.
- Break announcements: Sometimes, stepping back is stepping forward.
- Collaboration videos: Is strength in numbers the way to go?
- Clickbait videos: Risky, but can it work in your favor?
And guess what? Our findings are as wild as the comment section on your latest video !
The LLM analysed cautiously the title of all the 107,618 videos uploaded by these big youtubers during their respective crisis. The following plot shows how many videos fall into each of these categories among this considerable amount of videos, according to the LLM, based on their title.
We can already see that the most common strategy (maybe because it's the easiest and no public humiliation?) seems to be spamming clickbait videos. But is it the most effective strategies ? The response lies only in the data...
And here is what we obtain, the grail...
Not really what you would expect... we do understand your disappointement. Clickbait videos are the only type of videos that could have a positive impact on your recovery rate, and you might consider that selling your soul to the devil. But do not worry yet, these results have to be observed considering that they might suffer from a baseline bias. Let us explain: for example, one could think seeing the matched data that apology videos are pointless, but it could also just mean that your pears that had to undergo this tough exercise were knee down in the mud, suffering from controversy so big that there was no possible buy out from the public eye.

The (Exclusive) Strategy to Adopt

Let's first define what we mean by "strategy". In our case, a strategy is a combination of the different types of videos that a big youtuber can upload during a crisis. For example, you could decide to upload at least one tearful apology video, one clickbait visually eye-traumatising one and one video with friends (or all of the latter in the same video... a happy teary mess). This strategy would be considered as "Apology + Clickbait + Featuring". In this situation, your heart is still open on which type of videos to make in addition to those and you're not 100% sure on the final pathway you will employ.
Secondly, we define an "exclusive strategy" as a strategy where you decide to upload videos of certain types and to NOT upload any other type (you're just a loner, you hate admitting when you're wrong, or you're a human with ethics, yes joke intended). From our previous example (Apology, Clickbait and Featuring), this would be considered as the EXCLUSIVE strategy "Apology + Clickbait + Featuring".
Let's now see which exclusive or not strategies are the most adopted by the 1M+ club, and most importantly which ones are the most efficient. For this, we've gathered the proportion of Youtubers that has adopted each (exclusive) strategy, and the associated recovery rate. All you have to do is to click on the circle(s) of the strategy you want to adopt. If you are more into an exclusive strategy, just switch to the second graph, and select your exclusive strategy exactly the same way. The graph is designed so you can play around with the different pathways and see how they would impact your recovery rate. Have some fun with it, experiment with the combinations, until you find YOUR best fit.
Select a graph and enjoy:
While the proportions for each non-exclusive strategy are not the most insightful, the recovery tells us a lot about the the path to follow... Here are our recommendations:
- The "GO!"s: The most efficient (and widely adopted) strategies are the ones that include the clickbait videos with a recovery rate of almost always 50%. Combining this and a video that addresses your bad buzz seems to be the best duo.
- The "NO!"s: Apologizing in a video definitely seems to be counterproductive (recovery rate of 37%). All the worst recovery rates contain videos of this type. Even if your better judgment tells you to do it, it might be better to avoid begging for forgiveness.
- The case of Clickbait: A key observation on the proportions is that the majority of your colleagues did not limit themselves to only clickbait videos since the proportion falls down from 76% to 31% when we make the strategy exclusive. However, it keeps the highest recovery rate (52.2%) amongst the other exclusive single-type strategies.
- The troubled waters: On the other hand, we quickly notice that a lot of exclusive combinations have never been tested by our top 4% youtubers. This is the case for the "Break + Comeback" strategy (yes we know, not a rocket science combination). We wouldn't invite you to try them out, but we know some of you may have taste for challenge and adventure.
- Saving your apologies by clickbaiting: A major point is that when combined with "Clickbait" (only), the "Apology" video comes out of nowhere to demonstrate the fabulous recovery rate of 100%. But don't get too enthusiastic about this result, the proportion of Youtubers that have adopted this strategy is very low- however, it is still encouraging if that's what you had in mind.
- Multi-type strategies: The only multi-type strategies that have already been widely adopted are the "Clickbait + Featuring" (12% of the big youtubers tried this) and the "Clickbait + Bad Buzz Addressed" (5%) strategies. And whilst the first one doesn't seem to be optimal (only 49% of them recovered), the "Clickbait + Bad Buzz Addressed" demonstrates a recovery rate of 54%, giving you more than a 50% chance of saving your channel. Bring it on !
Let’s wrap it up: Conclusion
Congrats!
You tagged along the whole manual! You must really be desperate… but we appreciate your company. If we had to sum it up, we would say that declines are harder to recover that one might have imagine, and the proof lies in the data. Indeed, a big part of the interpretation wasn’t as significant as you and us would have wanted BUT we have still managed to make some accurate conclusions.
The first one being that your center of interest is a determinant of how your channel will fluctuate around declines, and our dear musicians are struggling more than your geeky gamer, when facing the Youtube algorithm.
Another thing to take away: posting more (whilst of course maintaining quality) will always be a good idea, whatever your popularity. You can try to fine-tune your video duration, change your topic but inherently what will count is your every-day posting.
If you’re one of the lucky 1M+ group, stakes are different and strategies must be taken. Unfortunately, being honest and transparent, taking times for yourself and making apologies doesn’t seem to be the move… which says a lot.
As much as we do wish for you to recover from the decline you’re going through, we also don’t want you to lose sight on what really matters: your creativity, which can only be brought out if you’re a fulfilled individual and content creator… and we are not sure that clickbaiting is how you’re going to get there. You know what we advise, you’ve seen the stats and the strategies to opt for, but question yourself on if you think losing a few hundred subscribers is worth changing your whole system. But that is a way more philosophical question that we will leave you hanging with.
Thanks for following our guide, we’re happy to be part of the amazing YouTube ecosystem with you.
See you around !
Ethical consideration
Data analysis includes many biases that would impact ethical aspects, and we tried our best to make ours an exception. The initial sampling performed and obtained through the dataset does not display any clear bias since gender, age and ethnicities etc… aren’t available, making it as inclusive as possible. However, due to the ‘english-speaking’ initial criteria, we remove myriads of country of origin which can include geographical bias.
No individual consent was needed since all info displayed has been and is made public on the Youtube platform. The only point of concern would be the Youtube channel that have been deleted since we still have their gathered data, but since they have been made public at some time period, it still seems acceptable to use them (especially since we mainly use only the ID from the channel more than the usernames).
The data required by our questionnaire is not saved and is only present locally on the viewer machine.
Our project is contributing as positively as possible to society.
References
@inproceedings{ribeiro2021youniverse, title={YouNiverse: Large-Scale Channel and Video Metadata from English-Speaking YouTube}, author={Ribeiro, Manoel Horta and West Robert}, year={2021}, booktitle= }
All icons have been taken from Canva.
Most of the interactive graphs have been done using flourish.
[1] Introduction picture: AI generated using Dali
[2] Picture PewDiePie: https://www.washingtonpost.com/technology/2018/12/20/forever-war-pewdiepie-youtubes-biggest-creator/
[3] Picture Jake Paul: https://commons.wikimedia.org/wiki/File:Jake_Paul_(53116882732).jpg?uselang=fr
[4] Picture Tana Mongeau: https://www.refinery29.com/en-us/2020/04/9640958/tana-mongeau-xanax-suicidal-thoughts-new-video
[5] Picture Logan Paul: https://www.nbcnews.com/tech/logan-paul-announces-buy-back-nfts-cryptozoo-rcna132390
[6] 3 pictures about upload frequency: AI generated using Dali